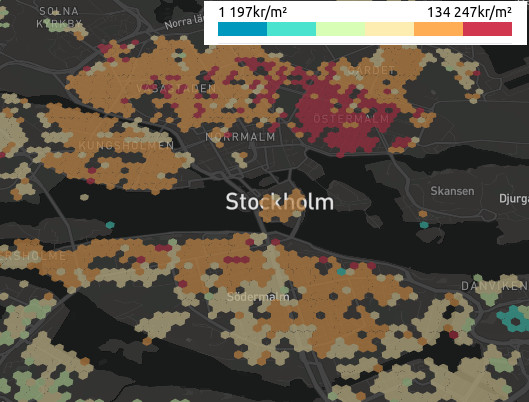
A heat map of apartment prices in central Stockholm
Disclaimer: I will be linking to sites in Swedish. A translation extension might be handy!
I, like a lot of people in Stockholm, need to buy an apartment. The rental situation is bad. Getting a “first-hand contract” is hard. I have friends who have even had to settle for temporary “third-hand” contracts!
With finding a rental unit out of the picture, buying is the only option. Buying an apartment in an inflated market during big increases in mortgage rates is not fun position to be in. So what should a data person such as myself do to identify which areas in Stockholm are reasonably priced? Plot all the data points on a heatmap! Which is what I set out to do.
My side project bostadsbussen scrapes user entered real estate listings from hemnet and archives them. You can read about the tech behind it in my previous blog post.
All right, we have a place to host a heatmap. First we need to get the data!
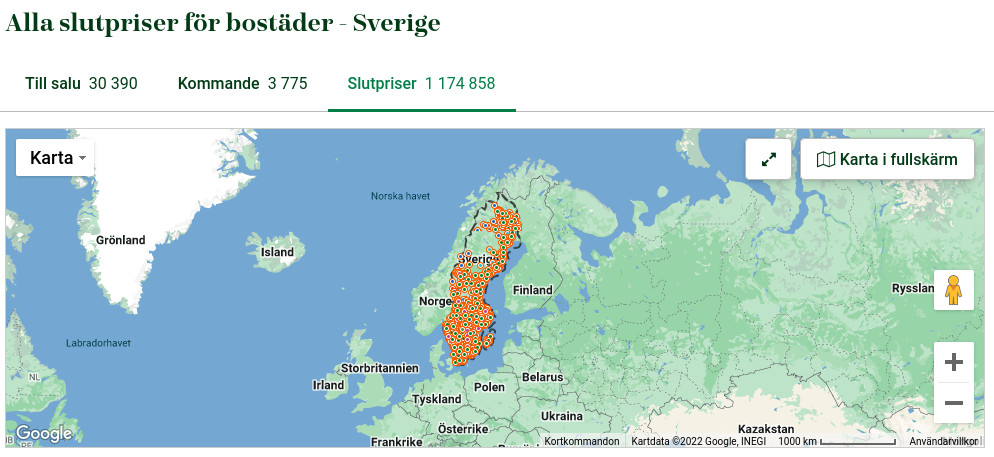 Picture of the closing prices page on hemnet.se
Luckily the data is out there on the internet! hemnet.se provides the closing prices for most of their listings. The problem is that they only return max 2500 results per search query. So we need to craft some queries to extract all the 1 million+ results on their site. It was as simple as limiting the search queries by different parameters until the result was lower than 2500. Then extracting the data from each listing was easy.
I was also very mindful of not putting unnecessary load on their servers.
I chose to not parallelize the scraping.
Getting all the listings took a week in real time.
Cool! Now we have a big JSON array with a million properties. Now I want to visualize this on an interactive map! And share it with the internet!
My first thought was to spin up a dashboarding solution like metabase or superset on a rented VM. They are both great tools and it would have been a great option. But a rented VM that can handle bursty traffic could be quite expensive. I also don’t want to deal with autoscaling stuff like kubernetes without getting paid 🤓
So I would need to build the visualization myself to get around renting a VM. I found deck.gl which is great for displaying large amounts of data on a map. Perfect!
We also need some map tiles that we can overlay the visualization from deck.gl on. Mapbox has an excellent free tier where the first 50000 views per month doesn’t cost anything. I doubt I will ever get more traffic than that.
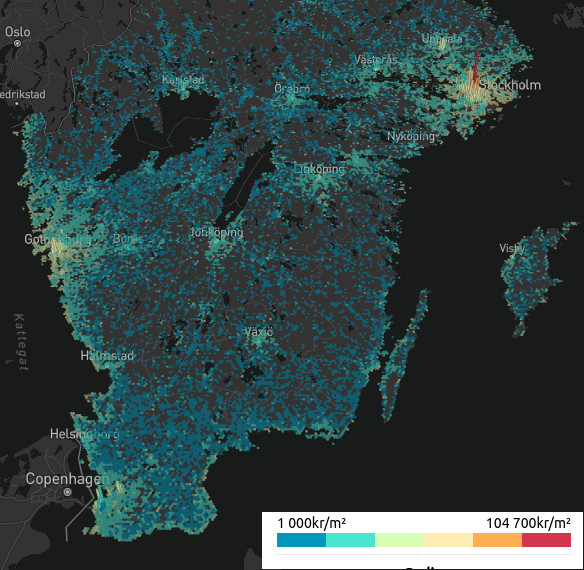 The heat map of southern Sweden (where all the reasonable people live (sorry Norrland))
OK, with this built locally on my machine I had a pretty cool visualization. I spent an hour dragging the map around Sweden to see if my pre-conceived notions about expensive areas was true. It was! (The Östermalm area in Stockholm is really expensive)
It works locally, now we need to host it! I chose Cloudflare Pages for this.
But it’s not really a visualization if there is no data to visualize.
This leads us to the problem of getting the data to the user.
My JSON array was 25MB compressed with gzip (125MB uncompressed). Hosting it on an object storage like GCS would cost nothing storage wise. The big problem would be the egress fees. GCS charges $0.12 per GB. If I got lucky (or unlucky) and had 10000 people download the data, I would be looking at $30 in just egress fees. Not good for a product with zero revenue!
Luckily Cloudflare’s object storage R2 has 0 egress fees. Zero! Now I could use that share the data to the user with a simple GET request.
I ran into some CORS problems for the public bucket but that was easily solved with this guide.
<?xml version="1.0" encoding="UTF-8"?>
<CORSConfiguration xmlns="http://s3.amazonaws.com/doc/2006-03-01/">
    <CORSRule>
        <AllowedMethod>GET</AllowedMethod>
        <AllowedMethod>HEAD</AllowedMethod>
        <AllowedOrigin>*</AllowedOrigin>
    </CORSRule>
</CORSConfiguration>
With the above allow all CORS, the data could be shared with everyone on internet. I don’t have to be worried about waking up to a huge cloud bill, since it all costs zero! An additional benefit was that I could provide the full json data. So other interested parties don’t need to hit hemnet.se servers and instead just download that file!
The map is available on https://bostadsbussen.se/sold/map (In Swedish!)
My next steps is to include some line charts for analysis and also make sure the json blob is updated with new data everyday. Kind of like a serverless dashboard!
I’m also reaching the end of my travel sabbatical (trekking in Nepal was a highlight!). So I’m looking for a Data Engineering or Infrastructure job. Based in Stockholm or EU remote. Here’s my resume
Shoot me an email at [email protected] if you want to talk 🤓